Open-source · 100% local · GPL-3.0
A visual exploration lab for art history
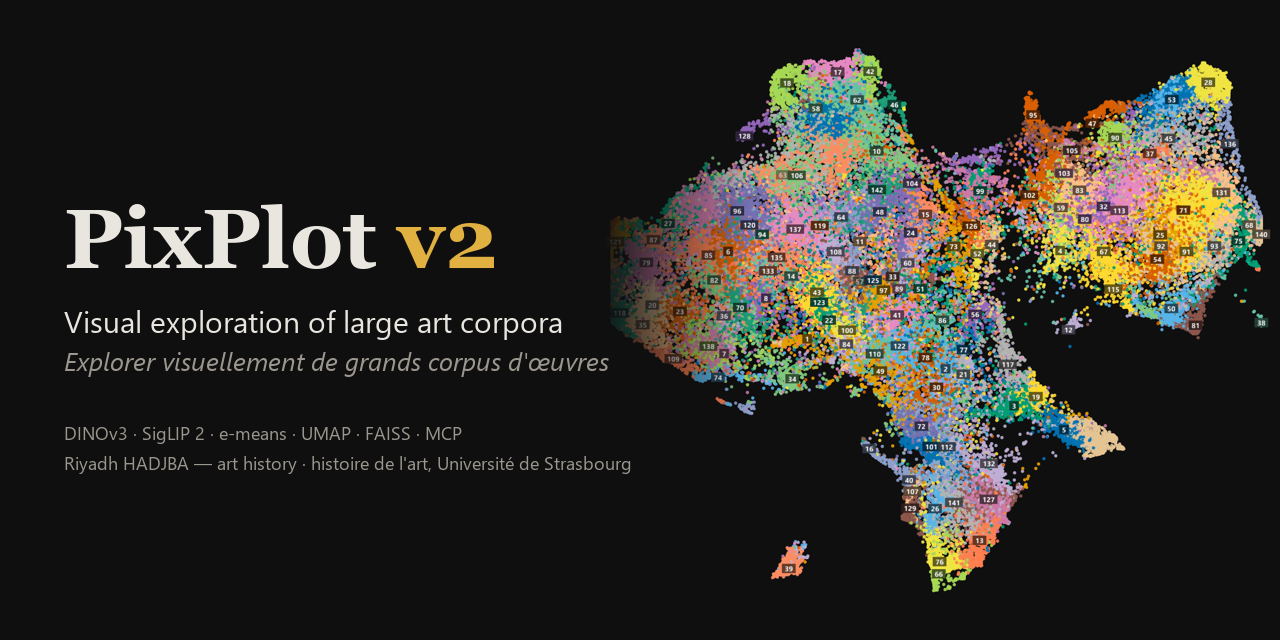
PixPlot v2 maps tens or hundreds of thousands of artworks by resemblance, finds formal kinships and recurring details, and hands its findings to a language model — without ever losing track of where each result comes from.
Latest version: v0.13.5 · changelog
Who does what
A computed resemblance is a lead, not proof of influence or attribution. PixPlot keeps the roles apart.
computes, observes and organises.
questions and suggests.
checks, interprets and builds knowledge.
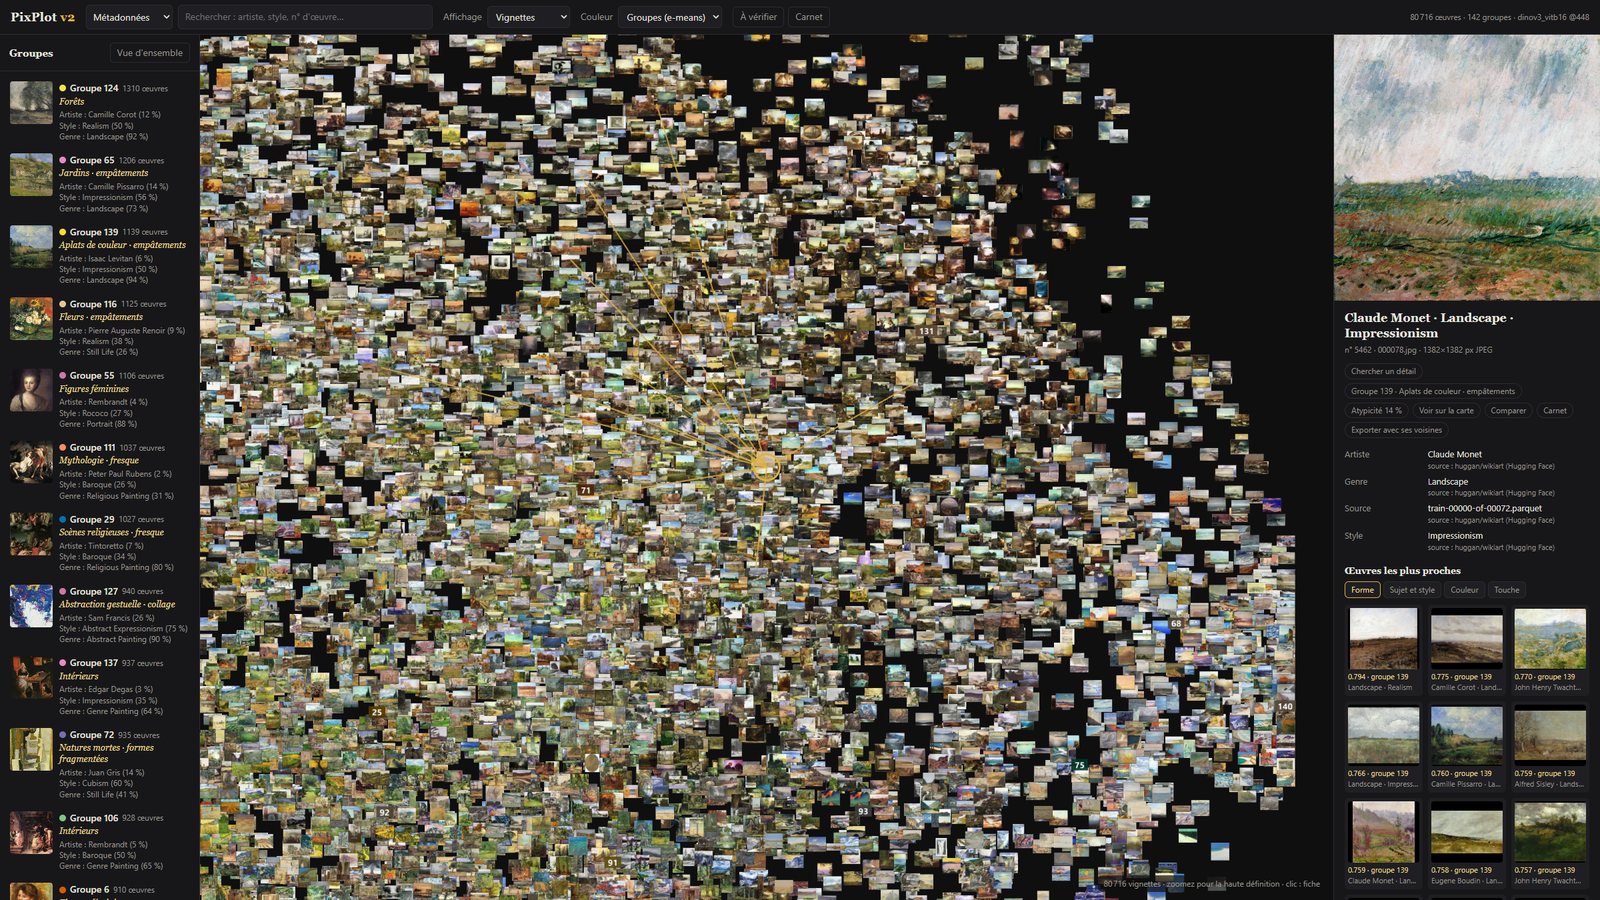
All of WikiArt, on one PC
Ingestion, DINOv3 and SigLIP 2 vectors, an index of 1.58 million image regions, groups, map, blind audit and benchmark — end to end, on an AMD Radeon RX 7900 GRE under Windows 11 with 16 GB of RAM.
Four ways of seeing
Each way of seeing answers a different question. Comparing them tells you why two works look alike — and their disagreements are information in themselves.
Form
Shapes, composition, motifs.
What is the layout?
Subject
What one would describe in words: subject, genre, school.
What is depicted?
Colour
Proportions of hues, lightness and saturation.
What palette?
Touch
Handling and stroke, regardless of the subject.
What brushwork?
What it does
An interactive Atlas, built for research rather than for show.
Search three ways
By metadata, by free description in French or English, or by detail: draw a box around a hand, a drapery, an object, and find similar regions across the corpus.
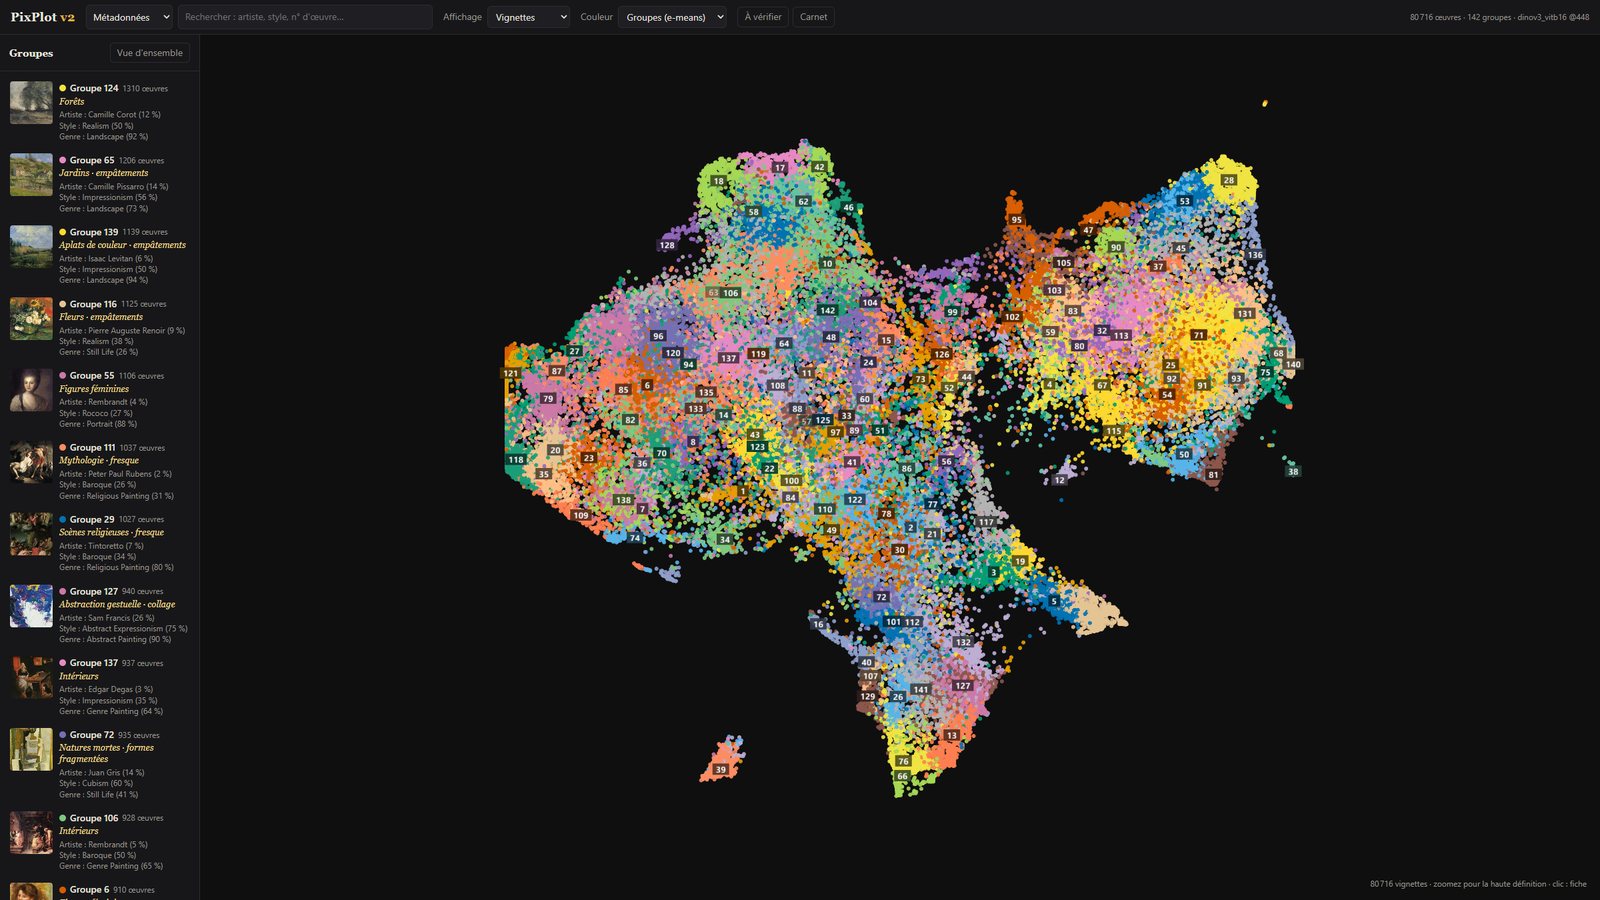
Groups that name themselves
Groups named from an art-historical vocabulary — “Religious scenes · tempera on panel” (Fra Angelico). Proposals, to be checked.
One map per way of seeing
Plus timeline and geographic layouts (offline world base map), a comparator for up to six works, and a research notebook.
A critical eye on the catalogue
A blind audit and a list of labels to check: works that all their neighbours contradict — a cataloguing error, or a truly singular work.
Museum collections
Any IIIF v2/v3 manifest or collection, with normalised metadata and rights. Validated on the Yale Center for British Art.
With Claude
An MCP server with 15 tools: Claude searches, looks at images and details, compares, and writes in your notebook — under cautious-interpretation rules.
Every result is a versioned run (model, parameters, parent run). Research Packs (.zip) bundle images, sourced metadata, explicit relations and provenance for a colleague or another LLM.
What the experiments showed
Measured on the 80,716 WikiArt works: share of the 10 nearest neighbours that share the work's label.
| Way of seeing | artist | style | genre | Pointillism | Fauvism |
|---|---|---|---|---|---|
| Form (DINOv3) | 50.8% | 52.4% | 76.8% | 21% | 20% |
| Subject (SigLIP 2) | 61.6% | 62.0% | 79.5% | 44% | 26% |
| Touch | 53.0% | 49.6% | 62.8% | 62% | 30% |
Subject beats manner for a purely visual model: the text-image space best recovers art-historical categories — partly because it has learnt their names from the web.
Touch recovers styles defined by handling (Pointillism: 21% → 62%) and recognises the artist's hand better than form.
Copies are found at rank 1 among 80,716 works (Raphael after Perugino, Van Gogh after Millet, Manet after Goya) — but as soon as the artist transforms the model (Picasso after El Greco), no way of seeing follows.
The labels themselves are sometimes wrong: the audit surfaces real cataloguing errors. And HDBSCAN does not scale on such a dense continuum.
The whole map
142 groups, in colour. Zoom in and every thumbnail is a real image you can open, compare and annotate.
Roadmap
The rule: measure before adding. A new model only enters the project if it wins on a benchmark and brings a signal the existing ways of seeing lack.
- 0.1–0.11
Done
Ingestion, four ways of seeing, Atlas, detail and text search, MCP server, IIIF, one map per way of seeing, pair benchmark, nested Leiden groups.
- 0.12
Disagreements, and pair review · tools done, review in progress
Works that one way of seeing brings together and another pulls apart; a panel to validate reference pairs.
Success if: about 100 validated pairs covering every kind of resemblance.
- 0.13
Searching a region with words
“halo”, “blessing hand”, “skull” — a sentence matched against image regions. TIPSv2 measured on RichArt and not adopted: SigLIP 2 on cropped regions does better.
Done with a SigLIP 2 region index: 1.6 million regions, searchable in the Atlas.
- 0.14
Naming groups with Iconclass
The museums' reference iconographic classification, with its notation as a verifiable source.
- 0.15
Composition
STELLAR (what is depicted and where), tested on validated filiations.
Full roadmap, with what is ruled out: ROADMAP.md.
Get started
Python 3.12. A GPU helps (AMD ROCm on Windows, or CUDA), but the whole pipeline also runs on CPU for testing. See the GPU guide.
# install
python -m venv .venv
.venv\Scripts\activate                 # Linux / macOS: source .venv/bin/activate
pip install -e ".[dev,ml]"

# a corpus, end to end
pixplot ingest "D:/MyImages"           # catalogue, thumbnails, duplicates
pixplot import-metadata meta.csv       # artist, date, style… ("path" column required)
pixplot embed                          # DINOv3 vectors (GPU), resumable
pixplot analyze                        # groups, UMAP map, neighbourhoods
pixplot serve --open                   # the Atlas at http://127.0.0.1:8765
Or the whole pipeline at once, with a timed log:
bash scripts/full_pipeline.sh data/my_corpus "My source". No image ever leaves your computer.
Author
Riyadh HADJBA, art history student at the University of Strasbourg. PixPlot v2 was designed and directed by Riyadh HADJBA, and written with the help of Claude (Anthropic).
Inspired by PixPlot (Yale DHLab, 2018); rewritten from scratch.
Credits
- Models: DINOv3 (Meta, DINOv3 licence, weights never redistributed), SigLIP 2 (Google, Apache 2.0).
- Libraries: FAISS, e-means, UMAP, scikit-learn, deck.gl, FastAPI, the MCP Python SDK.
- Base map: world-atlas, after Natural Earth.
- Group-name vocabulary partly from H. Honour and J. Fleming, The Visual Arts: A History (2023).
- Test corpora: WikiArt via huggan/wikiart and the Yale Center for British Art (IIIF). No corpus image is stored in the repository.